A Few Days Ago, I Faced My First Interview — And It Taught Me a Lot About Monitoring and Logging
By /Sahil Khan /BlogsA few days ago, I had an interview with a company. It was my very first technical interview — I was excited and nervous at the same time. Honestly, I couldn’t perform as well as I had hoped. But out of all the questions the interviewer asked, there was one that really stuck with me:
“If you get a status code 500, what would you do, and how would you fix it?”
At that moment, my mind went completely blank. I forgot what the 500 status code even meant, and I fumbled through the question. Later that day, I looked it up and realized that I actually did know it — I was just too anxious to respond properly.
A 500 Internal Server Error typically means that something has gone wrong on the server side. It could be due to a bug in the backend logic, misconfiguration, database failures, or even third-party service crashes. The server encountered an unexpected condition that prevented it from fulfilling the request — that's what 500 errors are all about.
What hurt the most was that I had worked with logging tools like Winston, and yet I failed to use that experience to answer the question.
For those unfamiliar, Winston is a popular logging library for Node.js. It allows developers to log useful data about requests, responses, errors, and more. These logs can be written to the console, saved to files, or even sent to third-party log management services. Winston helps developers keep track of what’s happening in the server — especially useful when debugging issues like 500 errors.
After the interview, I decided to dive deeper into server monitoring and observability. That’s when I discovered tools like Prometheus, Grafana, and Loki — three powerful technologies often used together in production environments to monitor remote servers, log data, and visualize system performance.
Why Monitoring Matters (A Real-Life Example)
Imagine this:
You’re working at a big company on a large-scale project. Your Node.js server runs with multiple containers and microservices, and everything is auto-scaled.
You go to sleep thinking everything is working perfectly. But the next morning, your boss walks in, looking frustrated.
"We got a lot of complaints from clients last night — things weren't working. What went wrong?"
You check your server, but everything looks fine. No errors, no issues. Your boss comes back a while later:
"Any updates?"
And you have to admit — "I’m not able to identify the problem."
At that moment, you deserve the scolding. Why? Because as a developer, you didn’t set up proper monitoring tools. If you had logs and metrics in place, you would’ve seen exactly what went wrong.
But you can avoid this kind of situation — if you keep reading this blog.
In this article, we’ll walk through how to set up Prometheus, Grafana, and Loki to monitor and debug a Node.js server.
Let's Start Building: Mock Node.js Server + Monitoring Tools
Step 1: Initialize a Node.js Project
npm init -y
npm i express
index.js
const express = require("express");
const { heavyTask } = require("./utils");

const app = express();

app.get("/", (req, res) => {
  res.send("Hello World!");
});

app.get("/heavy", async (req, res) => {
  try {
    const timeTaken = await heavyTask();
    res.send(`Heavy Task Completed! Time taken: ${timeTaken}`);
  } catch (error) {
    res.status(500).send("Something went wrong");
  }
});

app.listen(8080, () => {
  console.log("Server started on port 8080");
});
utils.js
const getSomeRandomNumber = (arr) => arr[Math.floor(Math.random() * arr.length)];
const getSomeRandomValue = (arr) => arr[Math.floor(Math.random() * arr.length)];

exports.heavyTask = () => {
  const ms = getSomeRandomNumber([1000, 5000, 10000, 15000, 20000]);
  const shouldThrowError = getSomeRandomValue([true, false]);

  if (shouldThrowError) {
    const randomError = getSomeRandomValue([
      "Something went wrong",
      "Error 404",
      "Error 500",
      "Error 502",
      "Error 503",
      "Error 504",
    ]);
    throw new Error(randomError);
  }

  return new Promise((resolve) => {
    setTimeout(() => resolve(ms), ms);
  });
};
Step 2: Add Prometheus Metrics
npm i prom-clientUpdate index.js
const client = require("prom-client");
const collectDefaultMetrics = client.collectDefaultMetrics;
collectDefaultMetrics({ register: client.register });

app.get("/metrics", async (req, res) => {
  res.setHeader("Content-Type", client.register.contentType);
  const metrics = await client.register.metrics();
  res.send(metrics);
});
Visit http://localhost:8080/metrics — you’ll see raw metrics collected from your app.
Step 3: Configure Prometheus
prometheus-config.yml
global:
  scrape_interval: 4s

scrape_configs:
  - job_name: prometheus
    static_configs:
      - targets: ["<YOUR_PRIVATE_IP>:8080"]
Get your private IP using:
ifconfigdocker-compose.yml
version: "3"
services:
  prom-server:
    image: prom/prometheus
    ports:
      - 9090:9090
    volumes:
      - ./prometheus-config.yml:/etc/prometheus/prometheus.yml
docker-compose upVisit http://localhost:9090 to view Prometheus.
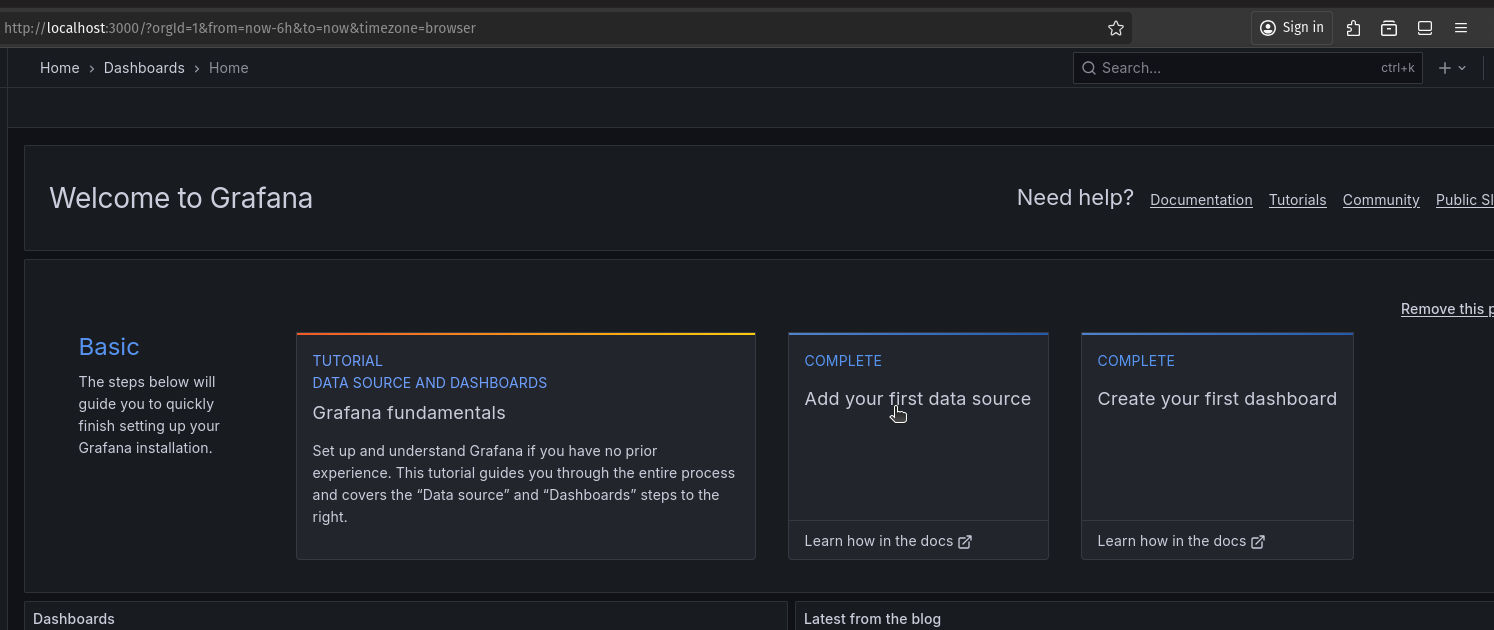
Step 4: Set Up Grafana
docker run -d -p 3000:3000 --name=grafana grafana/grafana-ossLogin at http://localhost:3000 with:
- Username:
admin - Password:
admin

Add a Prometheus data source with URL: http://<YOUR_PRIVATE_IP>:9090
Import Dashboard ID 11159 for Node.js monitoring.

Step 5: Add Loki for Logs
docker run -d --name=loki -p 3100:3100 grafana/lokiInstall Loki logger:
npm i winston winston-lokiLogger Setup
const { createLogger, transports } = require("winston");
const LokiTransport = require("winston-loki");

const logger = createLogger({
  transports: [
    new LokiTransport({
      host: "http://127.0.0.1:3100"
    })
  ]
});
Use in routes:
const express = require("express");
const { heavyTask } = require("./utils");
const client = require("prom-client");
const { createLogger, transports } = require("winston");
const LokiTransport = require("winston-loki");


const options = {
  transports: [
    new LokiTransport({
      host: "http://127.0.0.1:3100"
    })
  ]
};
const logger = createLogger(options);
const app = express();
const collectDefaultMetrics = client.collectDefaultMetrics;
collectDefaultMetrics({ register: client.register });

app.get("/metrics", async (req, res) => {
  res.setHeader("Content-Type", client.register.contentType);
  const metrics = await client.register.metrics();
  res.send(metrics);
});

app.get("/", (req, res) => {
  logger.info("on / route");
  // heavyTask();
  res.send("Hello World!");
});

app.get("/heavy", async (req, res) => {

  try {
    logger.info("on /heavy route");
    const timeTaken = await heavyTask();
    logger.info(`Heavy Task Completed! Time taken: ${timeTaken}`);
    res.send(`Heavy Task Completed! Time taken: ${timeTaken}`);
  } catch (error) {
    logger.error(error);
    res.status(500).send("Something went wrong");
  }
});

app.listen(8080, () => {
  console.log("http://localhost:8080");
});
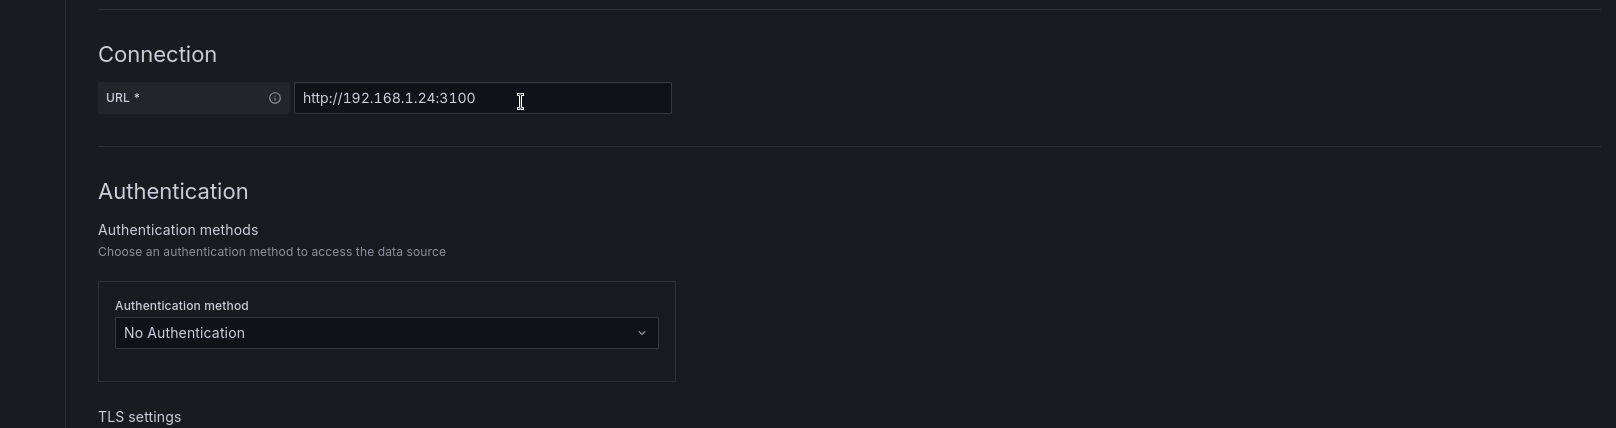
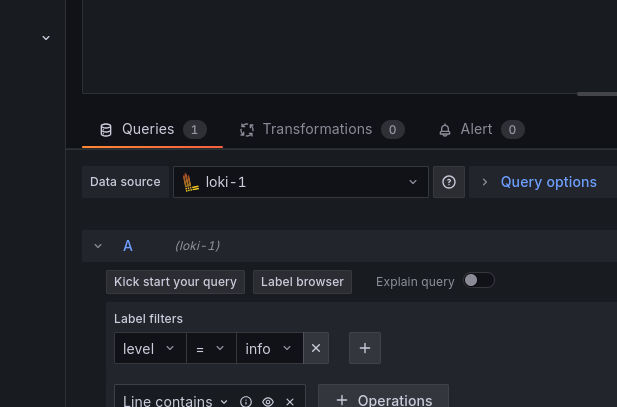
To visualize logs in Grafana using Loki, start by opening Grafana and navigating to Settings > Data Sources, then click "Add data source" and select Loki. In the URL field, enter http://<YOUR_PRIVATE_IP>:3100 and click "Save & Test" to verify the connection. Next, go to Dashboards > New > New Dashboard, and click "Add a new panel". In the panel editor, set the data source to Loki and enter a query such as {level="info"} or {level="error"} to filter logs based on severity. Click "Run query" to execute it. Finally, toggle the view to "Table" to display the log entries in a structured table format. You will now see the logs collected by Loki presented clearly in Grafana.


Wrapping Up
Now if your boss comes to you again and says clients faced issues, you won’t panic. You’ll go to your Grafana dashboard, check the logs, metrics, and find the problem easily. This setup gives you superpowers.
These tools — Prometheus, Grafana, and Loki — are much more powerful than what we covered here. But even this basic setup can save you hours of guesswork and embarrassing situations.
Hope you liked this article! If you have questions, feel free to mail I'll surely reply. And if you found this useful, please share it with your friends!
Phew! That was a lot to unpack, wasn't it?
If you made it this far—thank you for reading! I hope this post gave you something valuable to think about or try out.
If you found it helpful, insightful, or even just a little fun, I'd really appreciate it if you shared it on social media. It helps more than you think!